Labor Day weekend travel charts - I-5 U.S.-Canada border
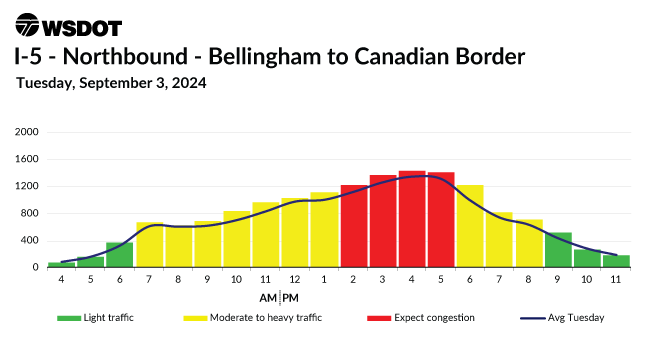
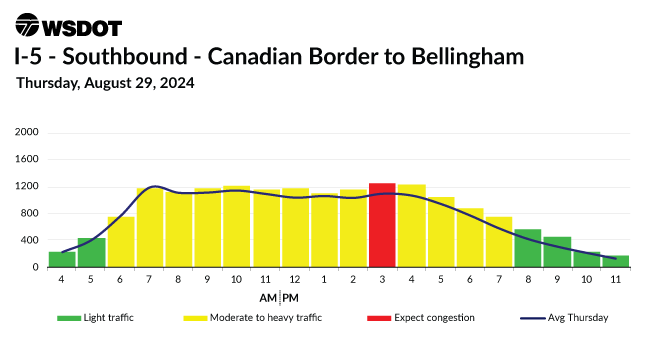
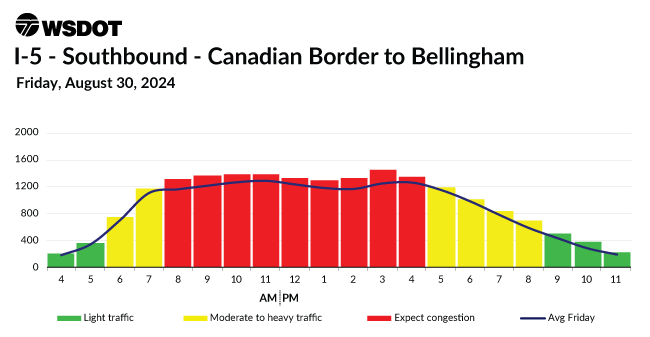
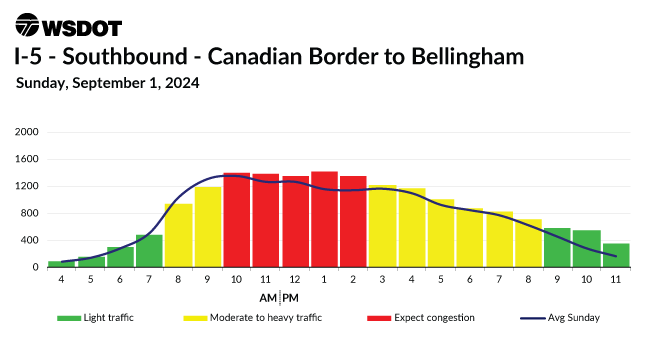
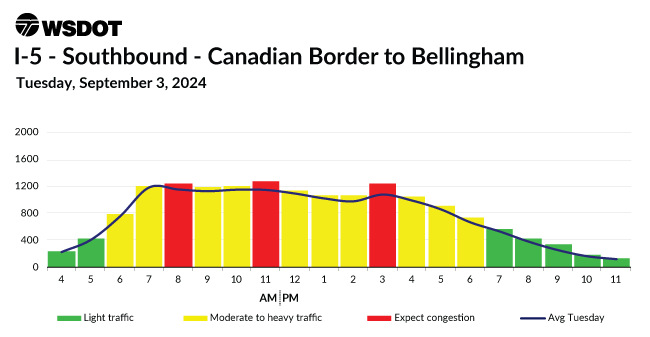
Labor Day weekend travel charts showing when I-5 at the U.S.-Canada border is expected to be the most congested to help plan your travel.
Reading the charts
The colors
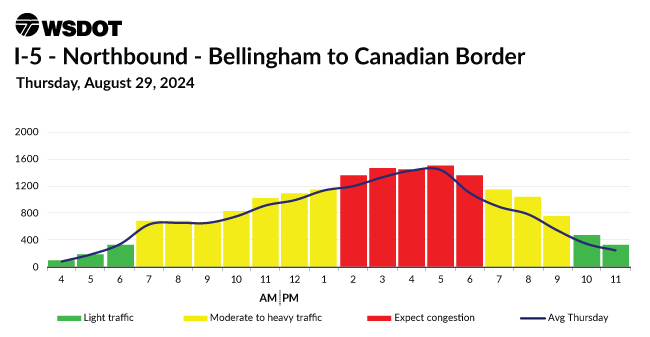
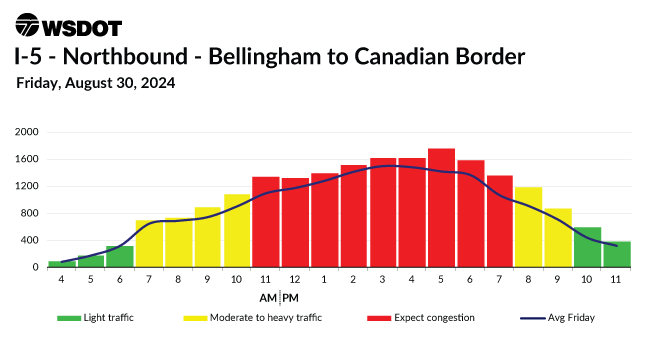
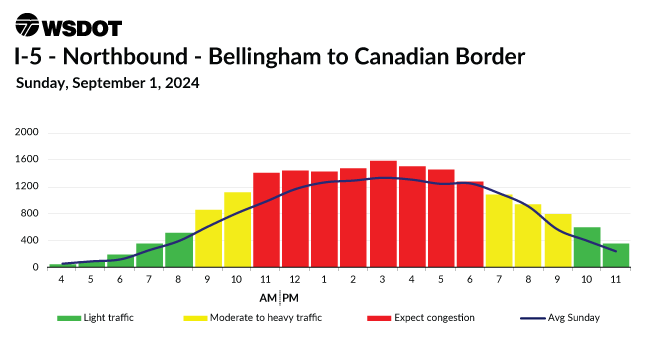
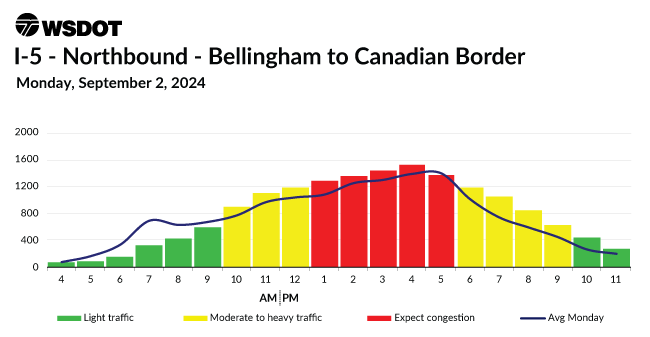
WSDOT traffic analysts looked at how many cars were on the road past Labor Day weekends. Based on this historical data, the graphs shows how many cars (vertical axis) we project to be on the road each hour (horizontal axis) for Labor Day weekend 2024. As the graphs turn from green to yellow, drivers can expect some congestion. During the red hours, traffic analysts predict travel will reach roadway capacity. Once a roadway reaches capacity, any small incident can cause significant backups.
The black line
The black line running from left to right shows typical traffic. This gives drivers more information on how the Labor Day 2024 holiday weekend travel may relate to a typical weekend.
Northbound
August 29
August 30
August 31

September 1
September 2
September 3
Southbound
August 29
August 30
August 31

September 1
September 2
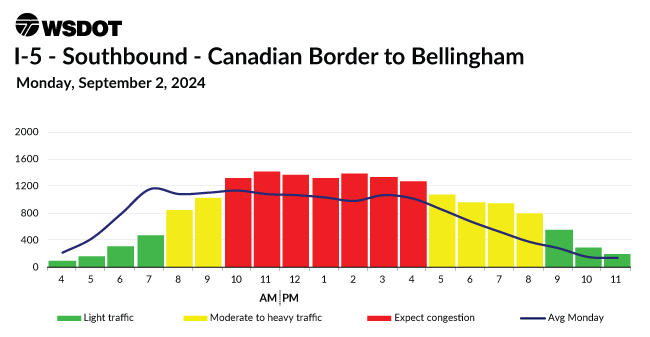
September 3
Slow down on ice and snow.
It's easier to skid or lose control traveling at higher speeds. Give yourself more time to stop.
Carry chains, practice installing them.
Winter conditions could mean chains are required on your route. Practice putting them on your vehicle ahead of time.
Pack your winter car kit.
Carry extra supplies like warm clothing, ice scraper and brush, jumper cables and other emergency items.
