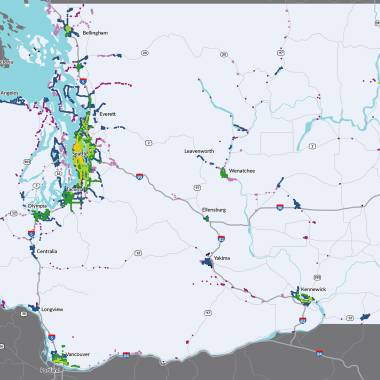
During its 2022 session, the Legislature passed a budget provision (ESSB 5689 (PDF 975KB) Sec 221(15)(a)) instructing WSDOT to produce a study that:
- Defines “frequent fixed-route transit” and “accessible frequent fixed-route transit.”
- Analyzes the state of Washington and identifies where gaps exist in these types of transit, particularly for certain demographics.
- Identifies how many people live within a half-mile walk of these types of transit.
- Provides potential funding scenarios to address those gaps.
The study was funded under the state multimodal transportation account-state appropriation.
The initial report defines seven levels of transit frequency based on aspects such as headway (i.e., how often there is service), span (i.e., when does service take place), and days of service. These levels acknowledge that frequent transit differs in communities around the state and reflects their unique characteristics.
Levels of frequent fixed route transit including weekday daytime headway, extended hours headway, weekend headway, and days of service.
| Frequency level |
Weekday daytime headway (9 a.m.-5p.m.) |
Extended hours headway (9 a.m.-5p.m.) |
Weekend headway (6-9 a.m. and 5 p.m.-10p.m.) |
Days of service (minimum) |
|
Level 1
|
<=12 minutes |
<=15 minutes |
<=15 minutes |
7 days
|
| Level 2 |
<=15 minutes |
<=30 minutes |
<=30 minutes |
7 days |
| Level 3 |
<=30 minutes |
<=60 minutes |
<=60 minutes |
7 days |
| Level 4 |
<=60 minutes |
- |
- |
5 days |
| Level 5 |
6 trips per day any time |
- |
- |
5 days |
| Level 6 |
2 trips per day any time |
- |
- |
5 days |
| 24-hour |
1 trip every 2 hours, overnight *10p.m.-6a.m.); 7 days |
The initial report included an analysis using U.S. Census data processed in ArcGIS to estimate how many people live within a half-mile of frequent fixed-route transit. Due largely to a lack of available walkway data, this approach does not take into account how easily people can access frequent fixed-route transit by walking.
Estimated number of people living within a half-mile of each fixed route transit frequency level.
| Frequency level |
Population estimate living within one-half mile |
Percent of Washington residents |
|
Level 1
|
530,000 |
7%
|
| Level 2 |
1,520,000 |
20% |
| Level 3 |
3,040,000 |
39% |
| Level 4 |
4,390,000 |
57% |
| Level 5 |
4,610,000 |
60% |
| Level 6 |
4,720,000 |
61% |
| 24-hour |
690,000 |
9% |
The final report identifies gaps in frequent transit through two scenarios, expanding frequent fixed route transit and other forms of public transportation. The population estimates represent the projected state population in 2038, which is the timeframe of the study’s funding scenarios. The difference between each scenario and benchmark is the current gap in frequent transit.
| Transit frequency |
Population served: benchmark |
Population served: scenario 1 |
Population served: scenario 2 |
| Level 1 |
640,000 (7%) |
2,750,000 (30%) |
1,840,000 (20%) |
| Level 2 |
1,840,000 (20%) |
3,670,000 (40%) |
4,590,000 (50%) |
| Level 3 |
3,670,000 (40%) |
5,050,000 (55%) |
5,320,000 (58%)
|
| Level 4 |
5,320,000 (58%) |
5,600,000 (61%) |
5,600,000 (61%) |
| Level 5 |
5,600,000 (61%) |
5,780,000 (63%) |
5,960,000 (65%) |
| Level 6 |
5,780,000 (63%) |
5,960,000 (65%) |
6,420,000 (70%) |
| 24-hour |
830,000 (9%) |
3,210,000 (35%) |
2,290,000 (25%) |
The final report outlines a cost framework to estimate costs for each service-expansion scenario. The framework analyzed operational and capital costs across the last 10 years to project total state transit-system costs for the next 15 years, through 2038.
Range of high and low estimates of expected costs for benchmark and scenario expansions for the next 15 years.
| - |
Expected 2038 annual system costs |
Expected total 15-year funding need |
15-year funding gap from benchmark |
|
No expansion from benchmark
|
$5-7 billion |
$64-83 billion |
-- |
| Scenario 1 expansion |
$10-14 billion |
$103-131 billion |
$39-48 billion |
| Scenario 2 expansion |
$8-11 billion |
$84-111 billion |
$20-28 billion |
The final report explored available demographic data to perform multiple analyses on disparities in transit access by race, age, and disability. These analyses were inconclusive.
Recommendations for future study:
-
In addition to researching fixed-route service, research the levels and types of demand-response service and measure access to these services within the state.
-
In collaboration with other departments, examine policy options that could integrate land use, energy, transportation, and other expansion requirements.
-
Collect data and develop systems to achieve more accurate analysis of disparities in access to fixed-route transit with a focus on accessibility, inclusion of people with disabilities, and other underserved communities.
-
Explore funding scenarios that provide stable and long-term funding sources to transit agencies, other municipal entities, and nonprofits to expand fixed-route transit, demand-response transit, Complete Streets, and other accessible infrastructure.

